Verifying docker for mac networking port forwarding
In the previous post, I inspected networking on linuxkit and docker for mac. But I didn’t verify the connectivity, and I was not 100% sure whether my diagram is correct one.
I tested the connection and routing with tcpdump / conntrack / strace.
Network flow to track
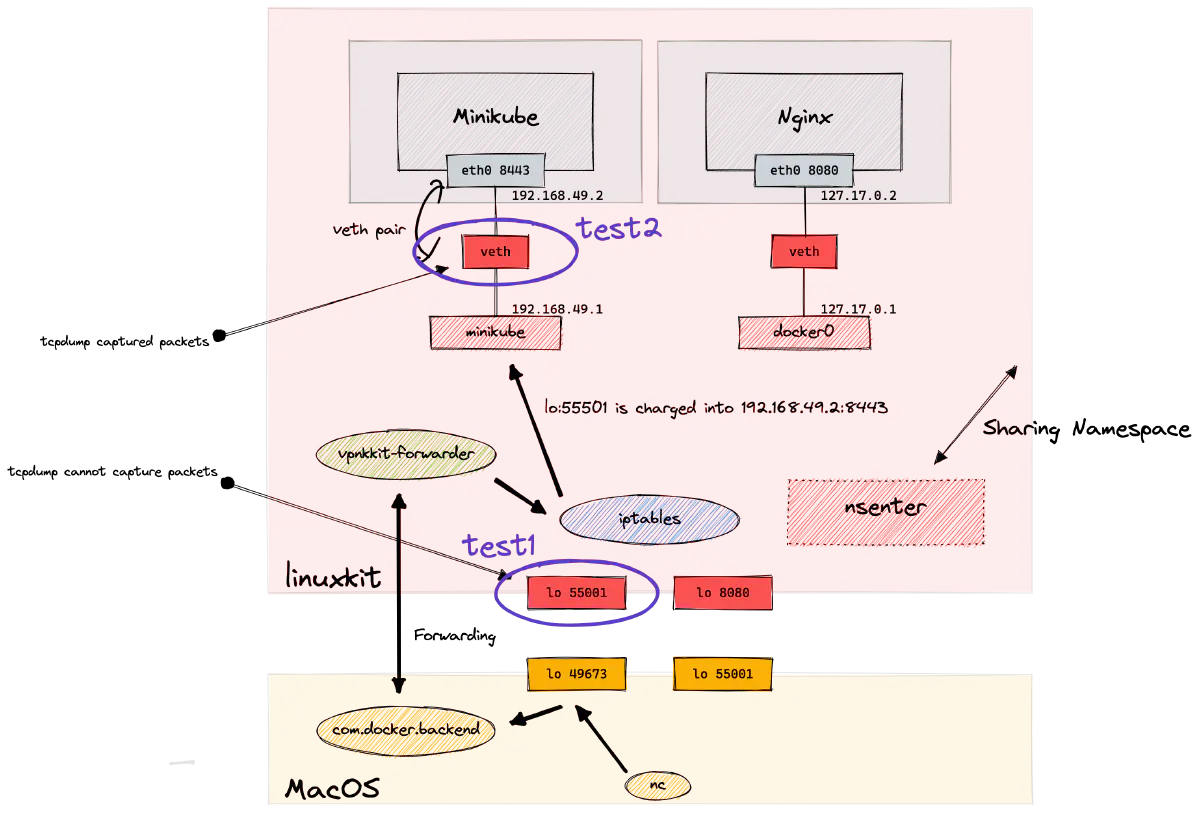
Going straight to bottom line, after the testing in this post, I found out the whole diagram of docker for mac networking is as follows:


image
×When I typed nc localhost:49763 on macOS, packets were forwarded as:
- com.docker.backend on macOS listens
lo:49673 - packets are forwarded to linuxkit VM and vpnkit-forwarder initiates the connection on Linux VM
- it sends the packets to
lo:55001but iptables nat configured by docker forward packets to192.168.49.2:8443 - minikube receives packets.
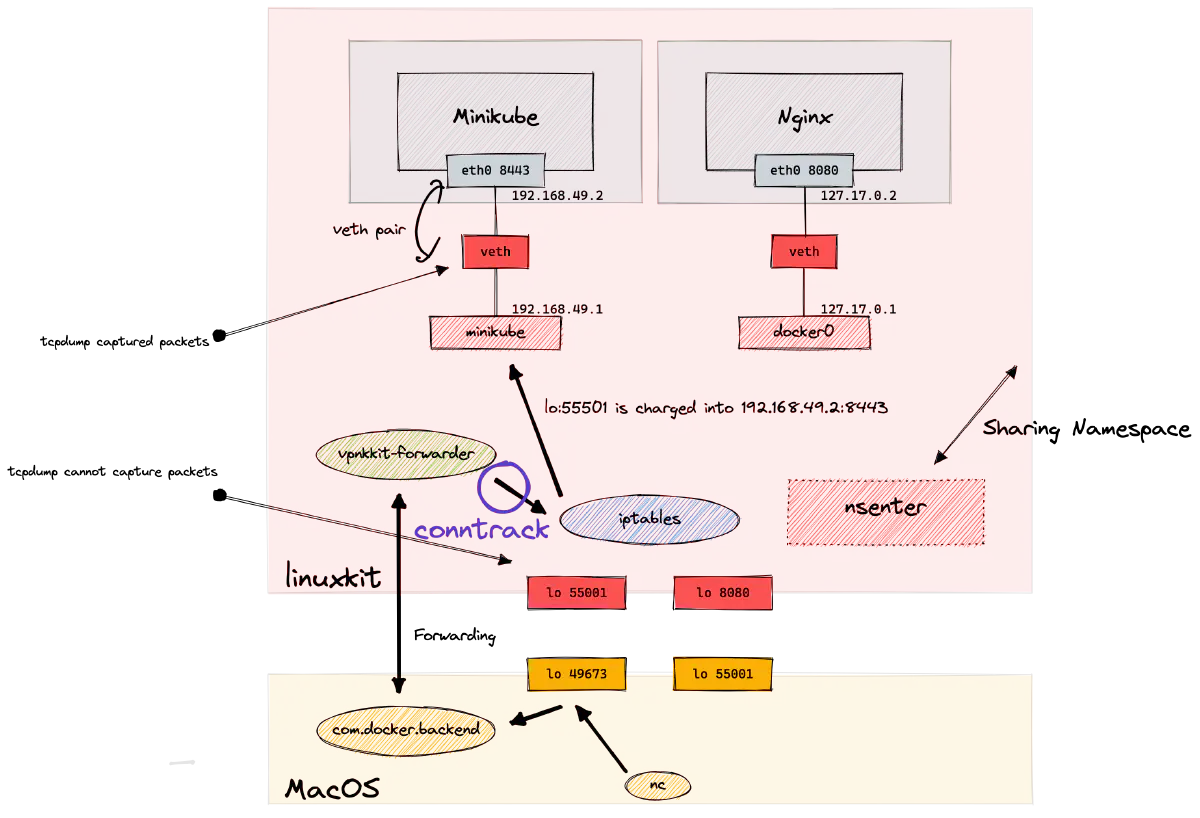
tcpdump
First, I tried to check packets on lo:55001 and veth (connected to minikube). To play around with linux VM, I used nsenter container.
nsenter is priviledged docker container to get login shell into linuxkit VM.
docker run -it --rm --privileged --pid=host justincormack/nsenter1
ref: https://gist.github.com/BretFisher/5e1a0c7bcca4c735e716abf62afad389

image
×test 1: lo - localhost (127.0.0.1)
On linuxkit VM (nsenter):
/ # nc 127.0.0.1 55001 -vv
127.0.0.1 (127.0.0.1:55001) open
test
^Csent 5, rcvd 0
punt!
To capture packets on lo:55001, I used sidecar container which was running in same netnamespace with nsenter (linuxkit).
% echo 'FROM alpine\nRUN apk add --no-cache tcpdump'\
 | docker build -t debug -f - . \
 && docker run -it --rm --cap-add=SYS_PTRACE --security-opt seccomp=unconfined --net=container:nsenter debug tcpdump -i lo -nn -X port 55001
[+] Building 1.4s (6/6) FINISHED
 => [internal] load build definition from Dockerfile                                                                                      0.0s
 => => transferring dockerfile: 85B                                                                                                       0.0s
 => [internal] load .dockerignore                                                                                                         0.0s
 => => transferring context: 2B                                                                                                           0.0s
 => [internal] load metadata for docker.io/library/alpine:latest                                                                          1.2s
 => [1/2] FROM docker.io/library/alpine@sha256:f271e74b17ced29b915d351685fd4644785c6d1559dd1f2d4189a5e851ef753a                           0.0s
 => CACHED [2/2] RUN apk add --no-cache tcpdump                                                                                           0.0s
 => exporting to image                                                                                                                    0.0s
 => => exporting layers                                                                                                                   0.0s
 => => writing image sha256:91b49e870701226a94dcb0c4ad5bbe70eb86f6a7c1530dbc817176f258d58ded                                              0.0s
 => => naming to docker.io/library/debug                                                                                                  0.0s

Use 'docker scan' to run Snyk tests against images to find vulnerabilities and learn how to fix them
tcpdump: verbose output suppressed, use -v[v]... for full protocol decode
listening on lo, link-type EN10MB (Ethernet), snapshot length 262144 bytes
Hmm nothing was recorded. This is because iptables transforms the destination before packets reach to lo:55001.
test 2: veth
Then I tried to capture packets on veth which was connected to minikube.
/ # ip addr
10: veth1c0aee2@if9: <BROADCAST,MULTICAST,UP,LOWER_UP,M-DOWN> mtu 1500 qdisc noqueue master br-a22db289b316 state UP
    link/ether d2:eb:39:5d:d6:49 brd ff:ff:ff:ff:ff:ff
    inet6 fe80::d0eb:39ff:fe5d:d649/64 scope link
       valid_lft forever preferred_lft forever
veth1c0aee2 was the one I tested. On linuxkit:
/ # nc 127.0.0.1 55001 -vv
127.0.0.1 (127.0.0.1:55001) open
^Csent 0, rcvd 0
punt!
And tcpdump captured the packets!
% echo 'FROM alpine\nRUN apk add --no-cache tcpdump'\
 | docker build -t debug -f - . \
 && docker run -it --rm --cap-add=SYS_PTRACE --security-opt seccomp=unconfined --net=container:nsenter debug tcpdump -i veth1c0aee2 -nn -X
[+] Building 1.0s (6/6) FINISHED
 => [internal] load build definition from Dockerfile                                                                                      0.0s
 => => transferring dockerfile: 85B                                                                                                       0.0s
 => [internal] load .dockerignore                                                                                                         0.0s
 => => transferring context: 2B                                                                                                           0.0s
 => [internal] load metadata for docker.io/library/alpine:latest                                                                          0.8s
 => [1/2] FROM docker.io/library/alpine@sha256:f271e74b17ced29b915d351685fd4644785c6d1559dd1f2d4189a5e851ef753a                           0.0s
 => CACHED [2/2] RUN apk add --no-cache tcpdump                                                                                           0.0s
 => exporting to image                                                                                                                    0.0s
 => => exporting layers                                                                                                                   0.0s
 => => writing image sha256:91b49e870701226a94dcb0c4ad5bbe70eb86f6a7c1530dbc817176f258d58ded                                              0.0s
 => => naming to docker.io/library/debug                                                                                                  0.0s

Use 'docker scan' to run Snyk tests against images to find vulnerabilities and learn how to fix them
tcpdump: verbose output suppressed, use -v[v]... for full protocol decode
listening on veth1c0aee2, link-type EN10MB (Ethernet), snapshot length 262144 bytes
10:09:05.237262 IP 192.168.49.1.59007 > 192.168.49.2.8443: Flags [S], seq 4126716280, win 65495, options [mss 65495,sackOK,TS val 998233269 ecr 0,nop,wscale 7], length 0
	0x0000:  4500 003c 00ee 4000 4006 567a c0a8 3101  E..<..@.@.Vz..1.
	0x0010:  c0a8 3102 e67f 20fb f5f8 b178 0000 0000  ..1........x....
	0x0020:  a002 ffd7 e382 0000 0204 ffd7 0402 080a  ................
	0x0030:  3b7f d4b5 0000 0000 0103 0307            ;...........
10:09:05.237389 IP 192.168.49.2.8443 > 192.168.49.1.59007: Flags [S.], seq 3146887047, ack 4126716281, win 65160, options [mss 1460,sackOK,TS val 1322807500 ecr 998233269,nop,wscale 7], length 0
	0x0000:  4500 003c 0000 4000 4006 5768 c0a8 3102  E..<..@.@.Wh..1.
	0x0010:  c0a8 3101 20fb e67f bb91 af87 f5f8 b179  ..1............y
	0x0020:  a012 fe88 e382 0000 0204 05b4 0402 080a  ................
	0x0030:  4ed8 70cc 3b7f d4b5 0103 0307            N.p.;.......
So, I couldn’t dump tcp packets as they were transformed into 192.168.49.2:8443 before it entered lo:55001. But I was able to see the packets at veth1c0aee2.
I needed to check the packets before NAT transformation.
conntrack is the exact tool to capture those flows!
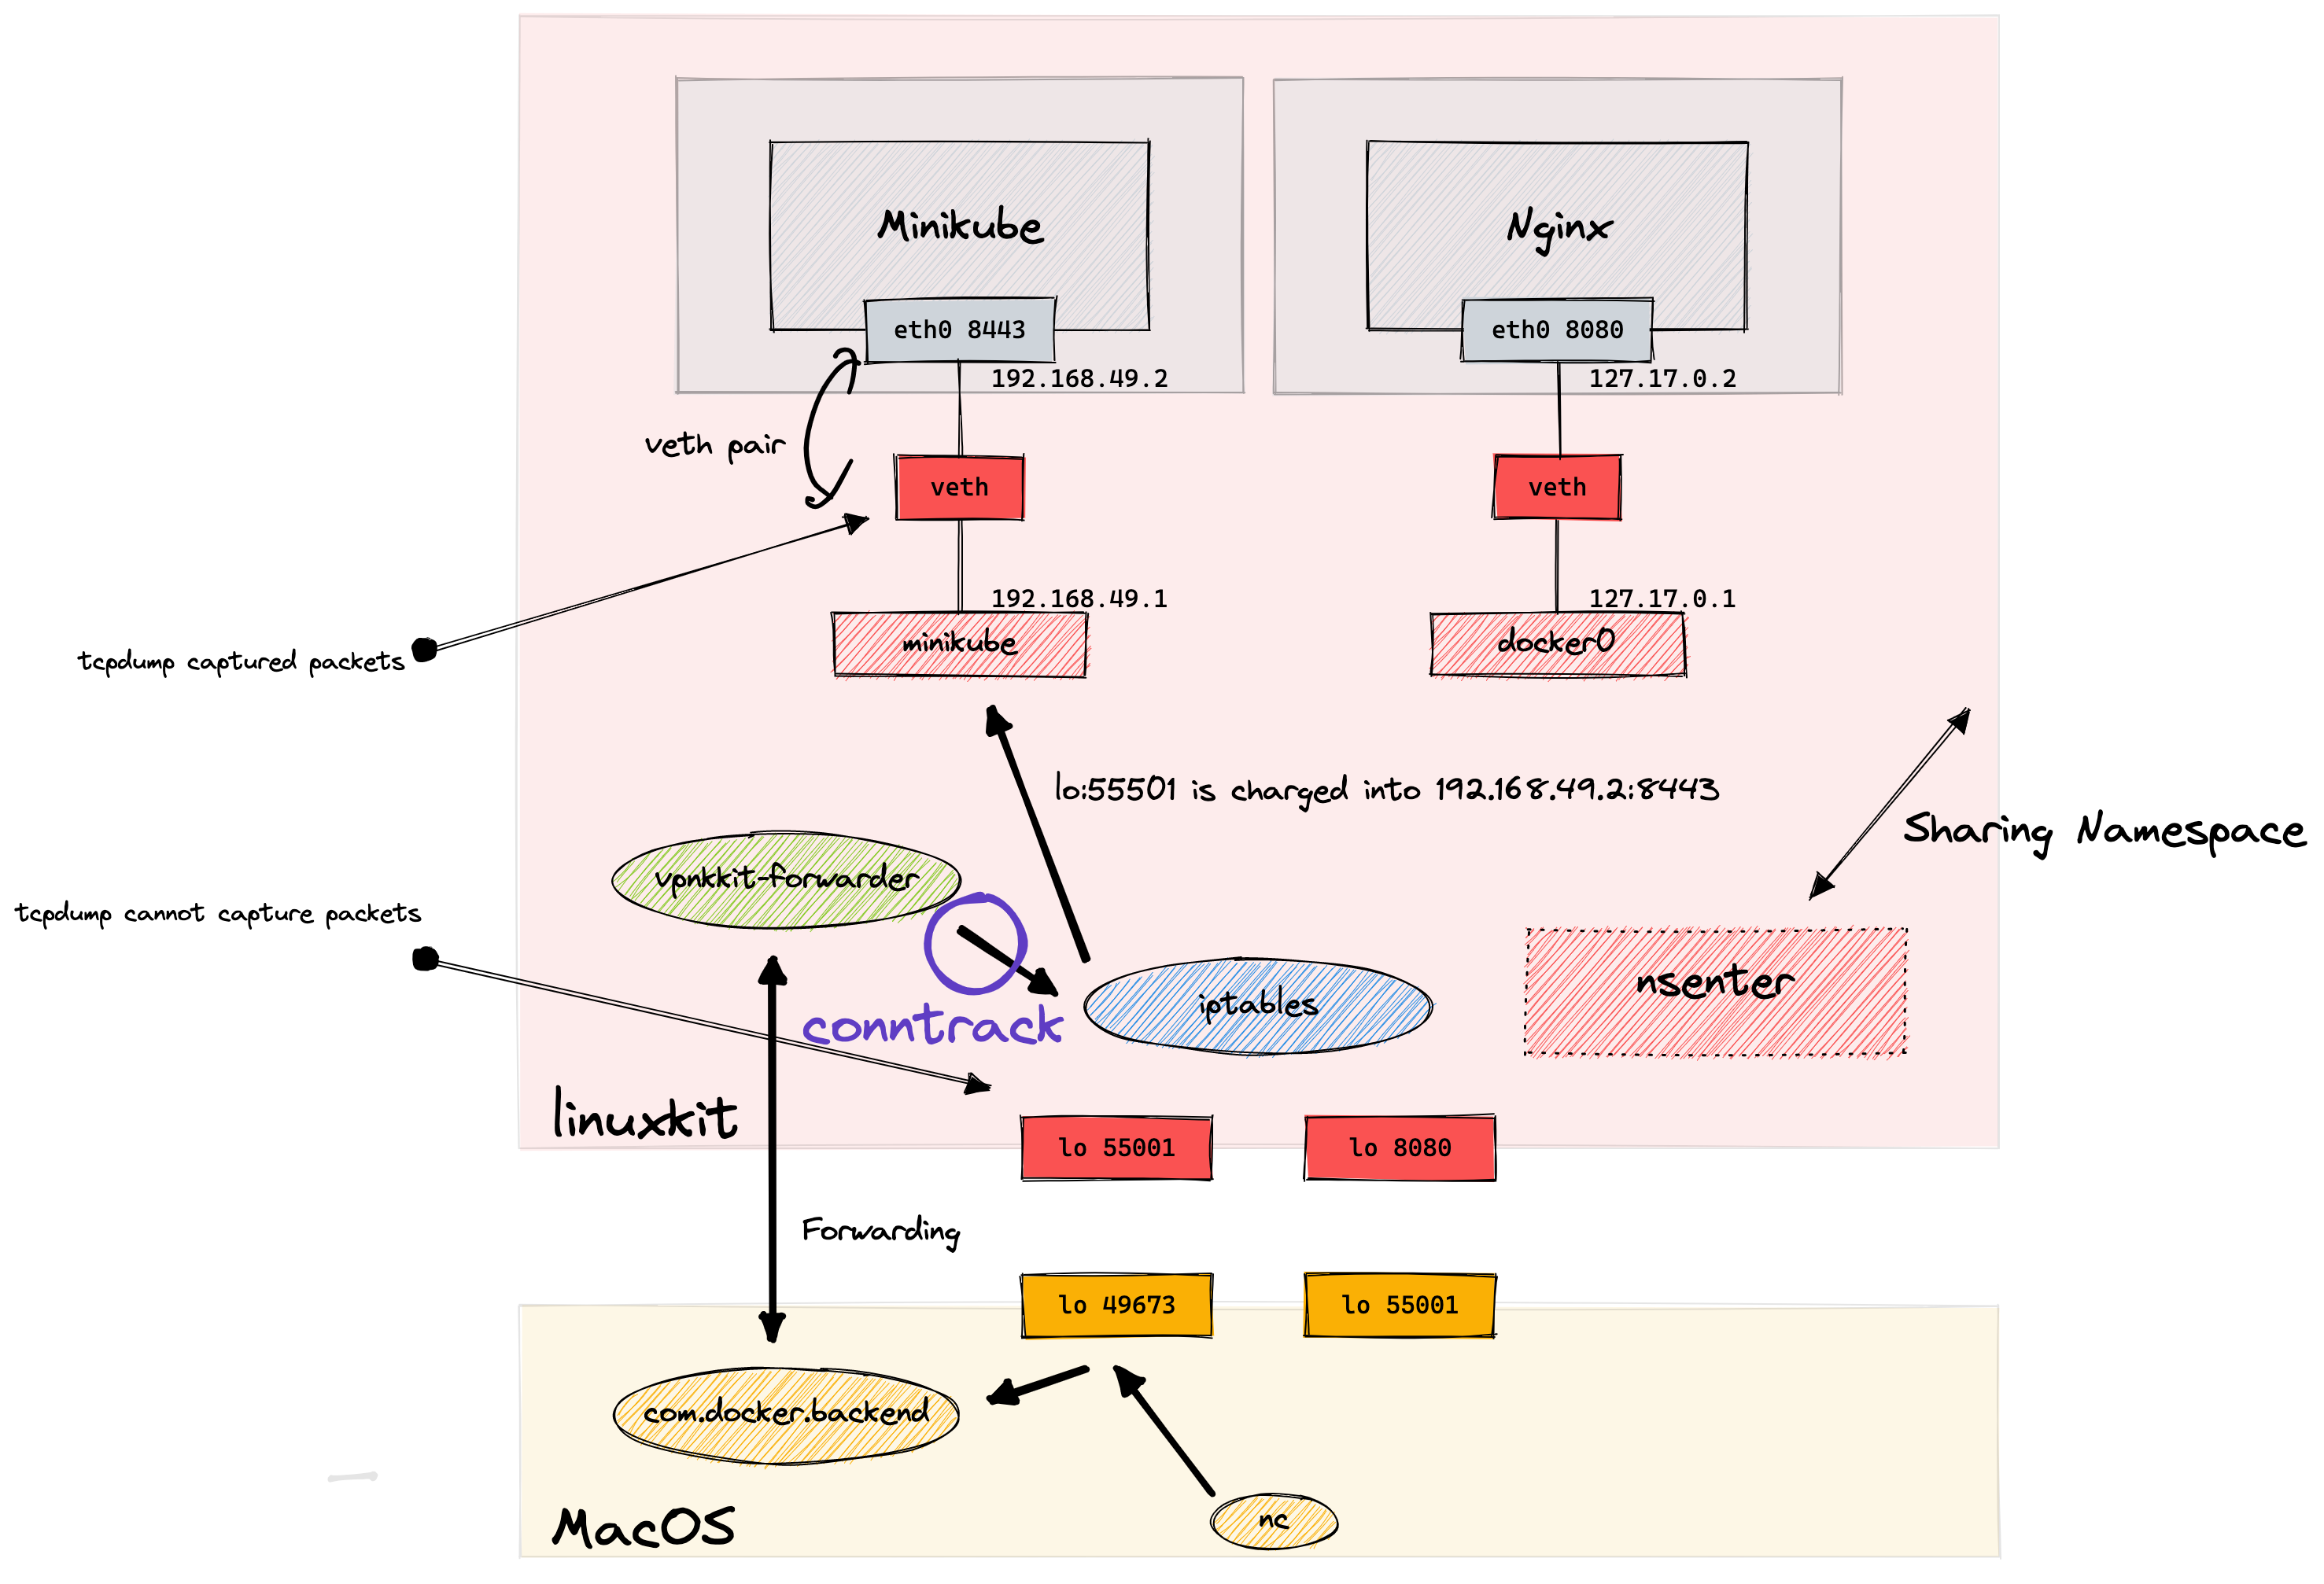
conntrack - get original IP address before iptables nat
Conntrack can record the connection flow before/after the iptables nat.
image
×On linuxkit (nsenter):
/ # nc 127.0.0.1 55001 -vv
127.0.0.1 (127.0.0.1:55001) open
test
^Csent 5, rcvd 0
punt!

/ # cat /proc/net/nf_conntrack
ipv4     2 tcp      6 100 TIME_WAIT src=127.0.0.1 dst=127.0.0.1 sport=56157 dport=55001 src=192.168.49.2 dst=192.168.49.1 sport=8443 dport=56157 [ASSURED] mark=0 zone=0 use=2
I was able to see 127.0.0.1:55001 was proxied to 192.168.49.1:8443 via iptables NAT.
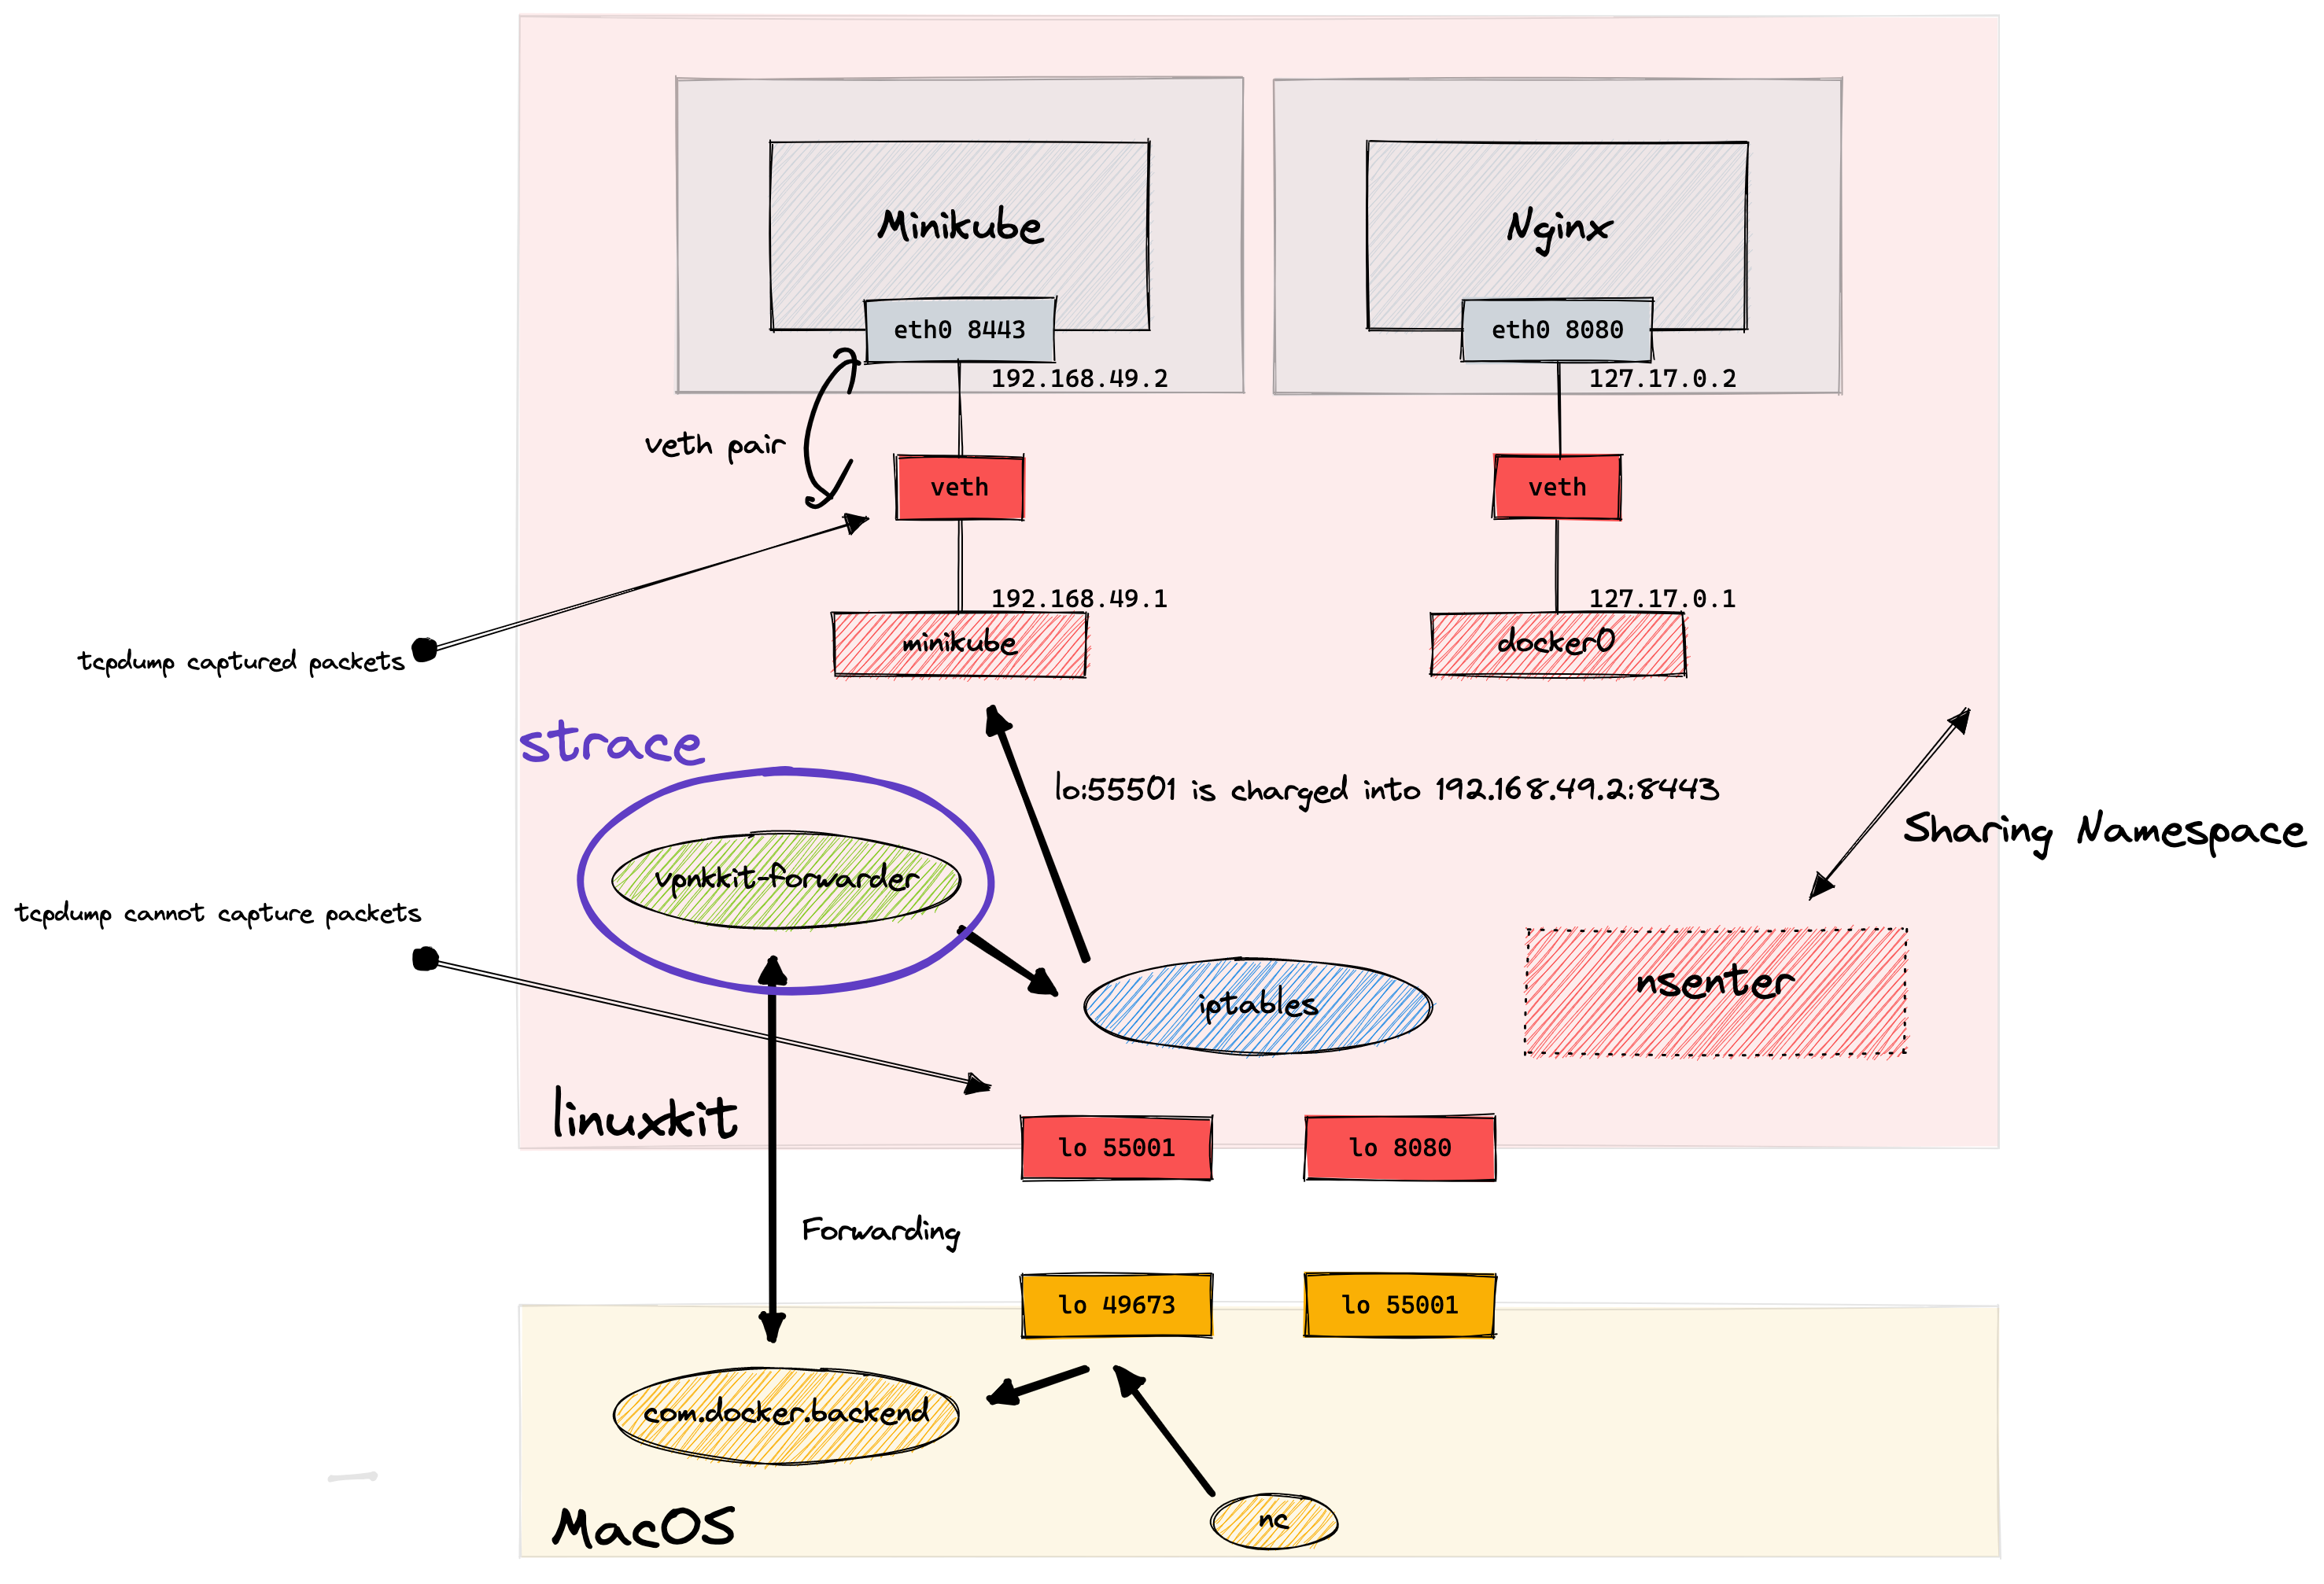
strace - identify the source process of the packet
The last thing to check is the source process of the packets. Based on port-forwarding, vpnkit is responsible for initiating the connection.
Inside the VM there is a connection demultiplexer which calls listen on this well-known port. This process calls accept and then reads a simple header which includes the ultimate destination IP and port (172.17.0.2:80 in the example above). The demultiplexer calls connect to the container port and starts proxying data.
So, I checked systemcall in vpnkit-forwarder to validate the source of packets.

image
×sidecar container for debug systemcall
I used similar one liner to run strace as tcpdump sidecar container
% docker run -it --rm --privileged --pid=host --name nsenter justincormack/nsenter1
% echo 'FROM alpine\nRUN apk add --no-cache tcpdump\nRUN apk add --no-cache strace'\
 | docker build -t debug -f - . \
 && docker run -it --rm --cap-add=SYS_PTRACE --security-opt seccomp=unconfined --pid=container:nsenter debug sh
[+] Building 1.6s (7/7) FINISHED
 => [internal] load build definition from Dockerfile                                                                                      0.1s
 => => transferring dockerfile: 115B                                                                                                      0.0s
 => [internal] load .dockerignore                                                                                                         0.1s
 => => transferring context: 2B                                                                                                           0.0s
 => [internal] load metadata for docker.io/library/alpine:latest                                                                          1.2s
 => [1/3] FROM docker.io/library/alpine@sha256:f271e74b17ced29b915d351685fd4644785c6d1559dd1f2d4189a5e851ef753a                           0.0s
 => CACHED [2/3] RUN apk add --no-cache tcpdump                                                                                           0.0s
 => CACHED [3/3] RUN apk add --no-cache strace                                                                                            0.0s
 => exporting to image                                                                                                                    0.0s
 => => exporting layers                                                                                                                   0.0s
 => => writing image sha256:583947251cb03fa74051a2636a252ee874023c50e5c0786856a8035c0b622b4b                                              0.0s
 => => naming to docker.io/library/debug
nsenter is a container to connect to linuxkit VM. This container shares pid and netns with host VM. debug is a container to run strace, which shares pid namespace.
--cap-add=SYS_PTRACE --security-opt seccomp=unconfinedis the option to allow container to runstrace--pid=container:nsenterspecify the container to run in same pid namespace withnsenter, which share the same namespace (ns, pid) with linuxkit VM
/ # ps | grep vpnkit
  307 root      0:00 /usr/bin/logwrite -n vpnkit-bridge /usr/bin/vpnkit-bridge --use-kernel-cmdline guest
  317 root      3:30 /usr/bin/vpnkit-bridge --use-kernel-cmdline guest
 1618 root      0:08 /usr/bin/containerd-shim-runc-v2 -namespace services.linuxkit -id vpnkit-forwarder -address /run/containerd/containerd.sock
 1641 root      0:05 /usr/bin/vpnkit-forwarder -data-connect /run/host-services/vpnkit-data.sock -data-listen /run/guest-services/wsl2-expose-ports.sock
382074 root      0:00 grep vpnkit
/ #
So, I assumed the process which initiated the connection in linuxkit was pid 1641 - vpnkit-forwarder.
netcat from linuxkit(nsenter)
First, I initiated a connection to minikube port 8443 from linuxkit VM localhost.
On nsenter container:
/ # nc 127.0.0.1 55001 -vv
127.0.0.1 (127.0.0.1:55001) open
test
^Csent 5, rcvd 0
punt!
On debug container:
/ # strace -f -p 1641 -e trace=connect
strace: Process 1641 attached with 10 threads
Since the connection was not initiated from macOS, I couldn’t see any system call here.
netcat from host (macOS)
Then, I initiated a connection to same container from macOS.
On macOS:
% nc 127.0.0.1 49673 -vv
Connection to 127.0.0.1 port 49673 [tcp/*] succeeded!
test
On debug container:
/ # strace -f -p 1641 -e trace=connect
strace: Process 1641 attached with 10 threads
[pid 373360] connect(8, {sa_family=AF_INET, sin_port=htons(55001), sin_addr=inet_addr("127.0.0.1")}, 16) = -1 EINPROGRESS (Operation in progress)
As I assumed, vpnkit-forwarder received the packet from macOS and it initiated the connection to 127.0.0.1:55001!
If I tested the connection to nginx (port 8080) I was able to see the HTTP messages in sytemcall log too. cool.
On macOS:
 % nc 127.0.0.1 8080 -vv
Connection to 127.0.0.1 port 8080 [tcp/http-alt] succeeded!
test
HTTP/1.1 400 Bad Request
Server: nginx/1.23.3
Date: Sat, 14 Jan 2023 09:36:53 GMT
Content-Type: text/html
Content-Length: 157
Connection: close

<html>
<head><title>400 Bad Request</title></head>
<body>
<center><h1>400 Bad Request</h1></center>
<hr><center>nginx/1.23.3</center>
</body>
</html>
On debug container:
# strace -f -p 1641  -s 1024
[pid  3260] <... read resumed>"HTTP/1.1 400 Bad Request\r\nServer: nginx/1.23.3\r\nDate: Sat, 14 Jan 2023 09:36:53 GMT\r\nContent-Type: text/html\r\nContent-Length: 157\r\nConnection: close\r\n\r\n<html>\r\n<head><title>400 Bad Request</title></head>\r\n<body>\r\n<center><h1>400 Bad Request</h1></center>\r\n<hr><center>nginx/1.23.3</center>\r\n</body>\r\n</html>\r\n", 32768) = 309
[pid  1677] <... epoll_pwait resumed>[{events=EPOLLIN|EPOLLOUT|EPOLLRDHUP, data={u32=1561722040, u64=140253718772920}}], 128, 0, NULL, 0) = 1
[pid  3260] write(4, "\v\0\4D\0\0\0005\1\0\0HTTP/1.1 400 Bad Request\r\nServer: nginx/1.23.3\r\nDate: Sat, 14 Jan 2023 09:36:53 GMT\r\nContent-Type: text/html\r\nContent-Length: 157\r\nConnection: close\r\n\r\n<html>\r\n<head><title>400 Bad Request</title></head>\r\n<body>\r\n<center><h1>400 Bad Request</h1></center>\r\n<hr><center>nginx/1.23.3</center>\r\n</body>\r\n</html>\r\n", 320 <unfinished ...>
Closing
I dig deeper into linux system call to understand the connection flow. The whole diagram would be as follows:
image
×